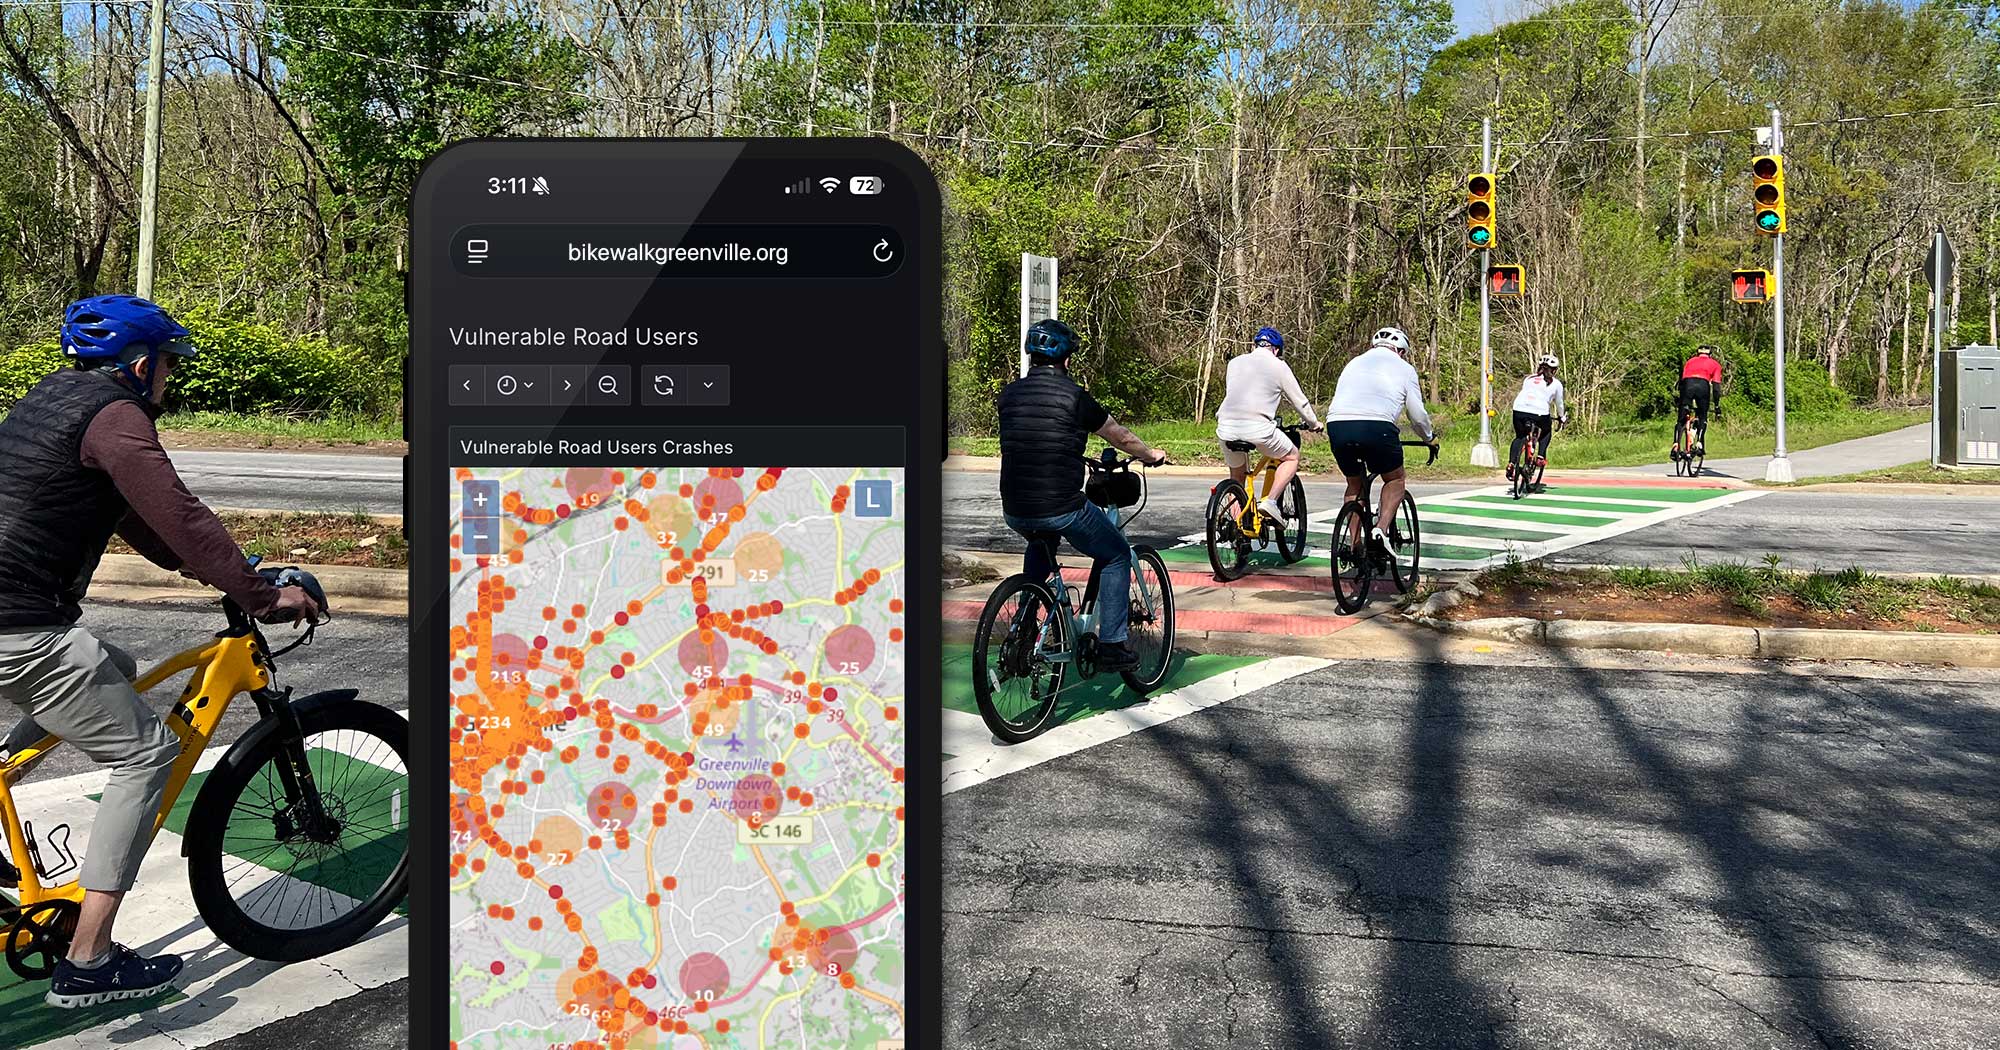
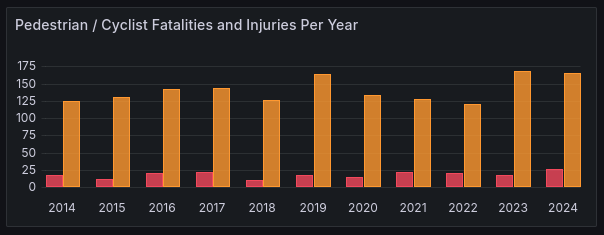
Vehicle crashes resulted in 185 pedestrian and 16 cyclist deaths. Another 1,021 pedestrians and 492 cyclists were injured. For reported noninjuries, 38 pedestrians and 24 cyclists were impacted. Noninjuries include property damage and unreported injuries. In 2024 alone, 22 pedestrians and four cyclists were killed, the highest number of yearly deaths in the ten-year period. As seen on the interactive dashboard, there is a consistent rate of fatalities and injuries. Just a few days ago, one pedestrian and one cyclist were killed in two separate incidents in Greenville County.
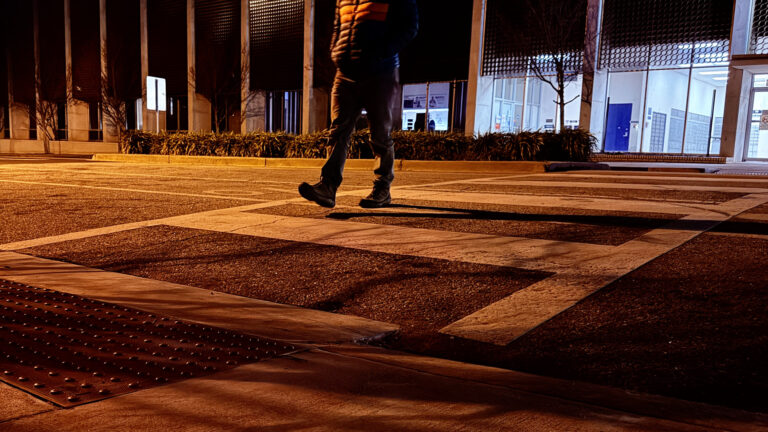
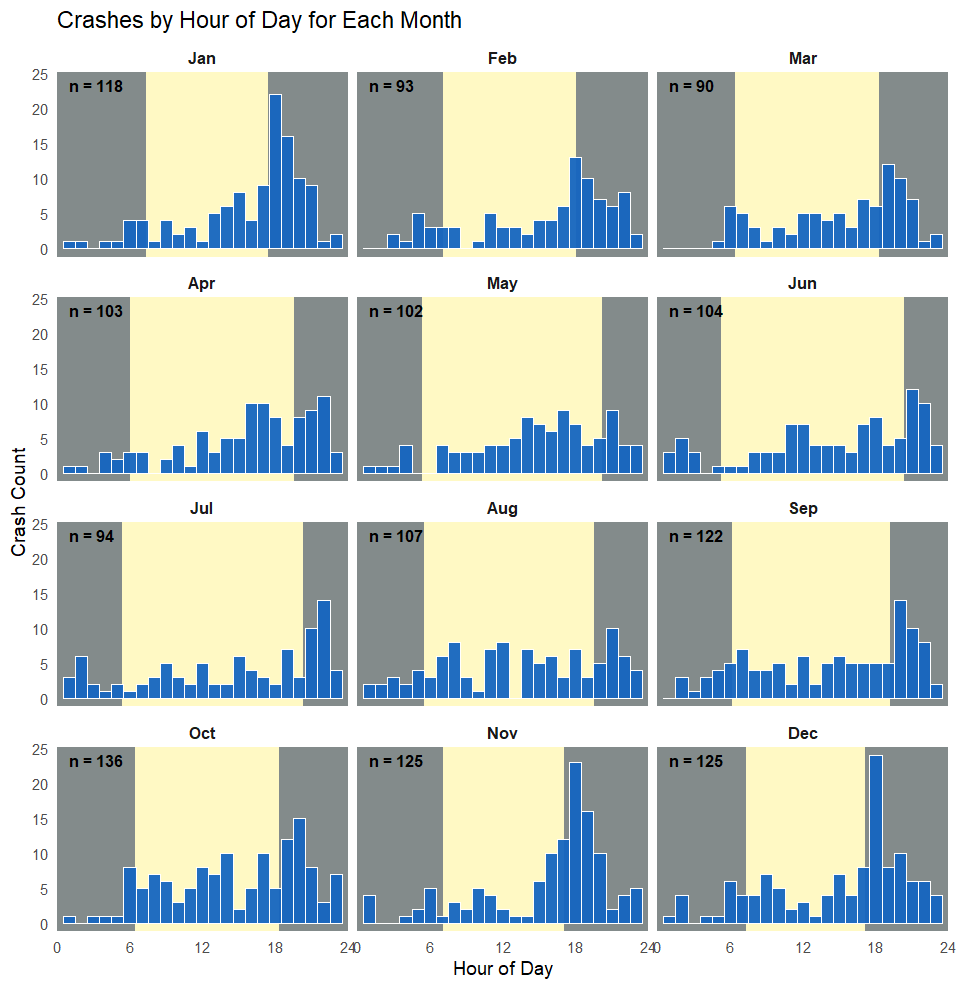
Since the start of Daylight Saving Time, there is an increased threat to pedestrians and cyclists. As seen in the graphs below, more crashes occur in November, December, and January with the sun setting earlier in the evening. Throughout the year, most crashes happen after sunset.
According to the National Highway Traffic Safety Administration and SCDOT reports, South Carolina has one of the highest pedestrian death rates in the nation. Smart Growth’s 2024 Dangerous by Design report ranks South Carolina third for most deadly states according to pedestrian fatalities. In 2020, 187 pedestrians were killed in South Carolina, representing 18% of total traffic fatalities. And the numbers are increasing. The state recorded 194 pedestrian deaths in 2021 and another 200 pedestrian deaths in 2022. According to SCDOT’s 2021 data, one pedestrian is hit and killed every 1.9 days.
The crash and fatality numbers are also staggering for cyclists. In 2024, the League of American Bicyclists ranked South Carolina #47 for bike-friendly states and #48 for total fatalities per 10,000 bike commuters. In 2021, there were a total of 434 collisions with cyclists, 23 of which resulted in fatalities. Cyclist fatalities increased by 43.8% between 2020 and 2021. One cyclist is hit and killed every 15.9 days
SCDOT’s Pedestrian and Bicycle Safety Action Plan reports that South Carolina ranks fifth in the nation for pedestrian fatalities per capita. Between 2009 and 2019, pedestrian deaths increased by 80% and cyclist deaths increased by 50%. Despite the common myth that vulnerable road users cause crashes, the data shows the opposite: pedestrians and cyclists account for 20% of all highway fatalities but are responsible for only 1% of all crashes. From 2015–2019, the comprehensive cost of all pedestrian and cyclist crashes—fatal, injury-related, and non-injury — totalled $8.98 billion. These figures make clear that South Carolina faces a significant economic, social, and public safety crisis.
In response to Greenville’s pedestrian and cyclist crash data, Mayor Knox White committed the city to Vision Zero by 2037, a target of zero vulnerable road user fatalities and serious injuries. City Council allocated $250,000 in the 2022 budget for the city’s Pedestrian Safety Action Plan, which used crash data, citizen feedback, and cost-benefit analysis to identify and implement key road safety measures. According to the city’s crash cost analysis, the weighted average cost per crash is $1,182,100. The city has identified 18 key roadways with severe crash histories as priorities for redesign to improve pedestrian and cyclist safety. Important improvements to the city’s roadways are underway on busy streets like Pendleton Street and Stone Avenue. Over the past two years, the city has installed 500 pedestrian ramps and 679 high visibility crosswalks. The city has also installed or repaired about 3 miles of sidewalks and 10 miles of bike lanes.
Infrastructure design is a significant decision that can influence the safety of our streets and all of its users. As a result of this dire tragedy, SCDOT adopted a Complete Streets policy to require safe and inclusive transportation networks. They also implemented multimodal transportation guidance with their updated design manuals, as well as new guidelines for enhanced crosswalks. Infrastructure safety measures drastically reduce deaths and injuries among vulnerable road users. For example, installing intersection lighting can decrease pedestrian crashes by 42% and high-visibility crosswalks reduce crashes by 40%. Stay tuned for a new study on the impact of improved lighting for White Horse Road, one of the most dangerous and deadly roads for pedestrians and cyclists in Greenville County.
South Carolina’s laws also have an incredible impact, such as the recent Hands Free SC law, which prohibits using a phone while driving. Likewise, if the state permitted camera enforcement for drivers who speed and run red lights, we could dramatically reduce vehicle speeds and thus the number and severity of crashes.
These solutions are not out of our hands. In addition to more inclusive urban planning and state policy, driver education and awareness of pedestrians and cyclists are essential to ensuring their safety. All road users can abide by the rules of the road and show respect for each other’s humanity. With all of our collective advocacy and awareness, we hope to create a map ten years from now with far fewer icons.